Building on the success of the virtual (2021) and hybrid (2023) events, the third edition of the hybrid workshop on ImmunoBiophysics: From Fundamental Physics to Understanding the Immune Response took place from 27 April to 2 May 2025 in Les Houches, France.
This year’s workshop focused on immune cell regulation from a distinctly physical and mechanical perspective, with the aim of advancing opportunities for translational impact in human health and disease.
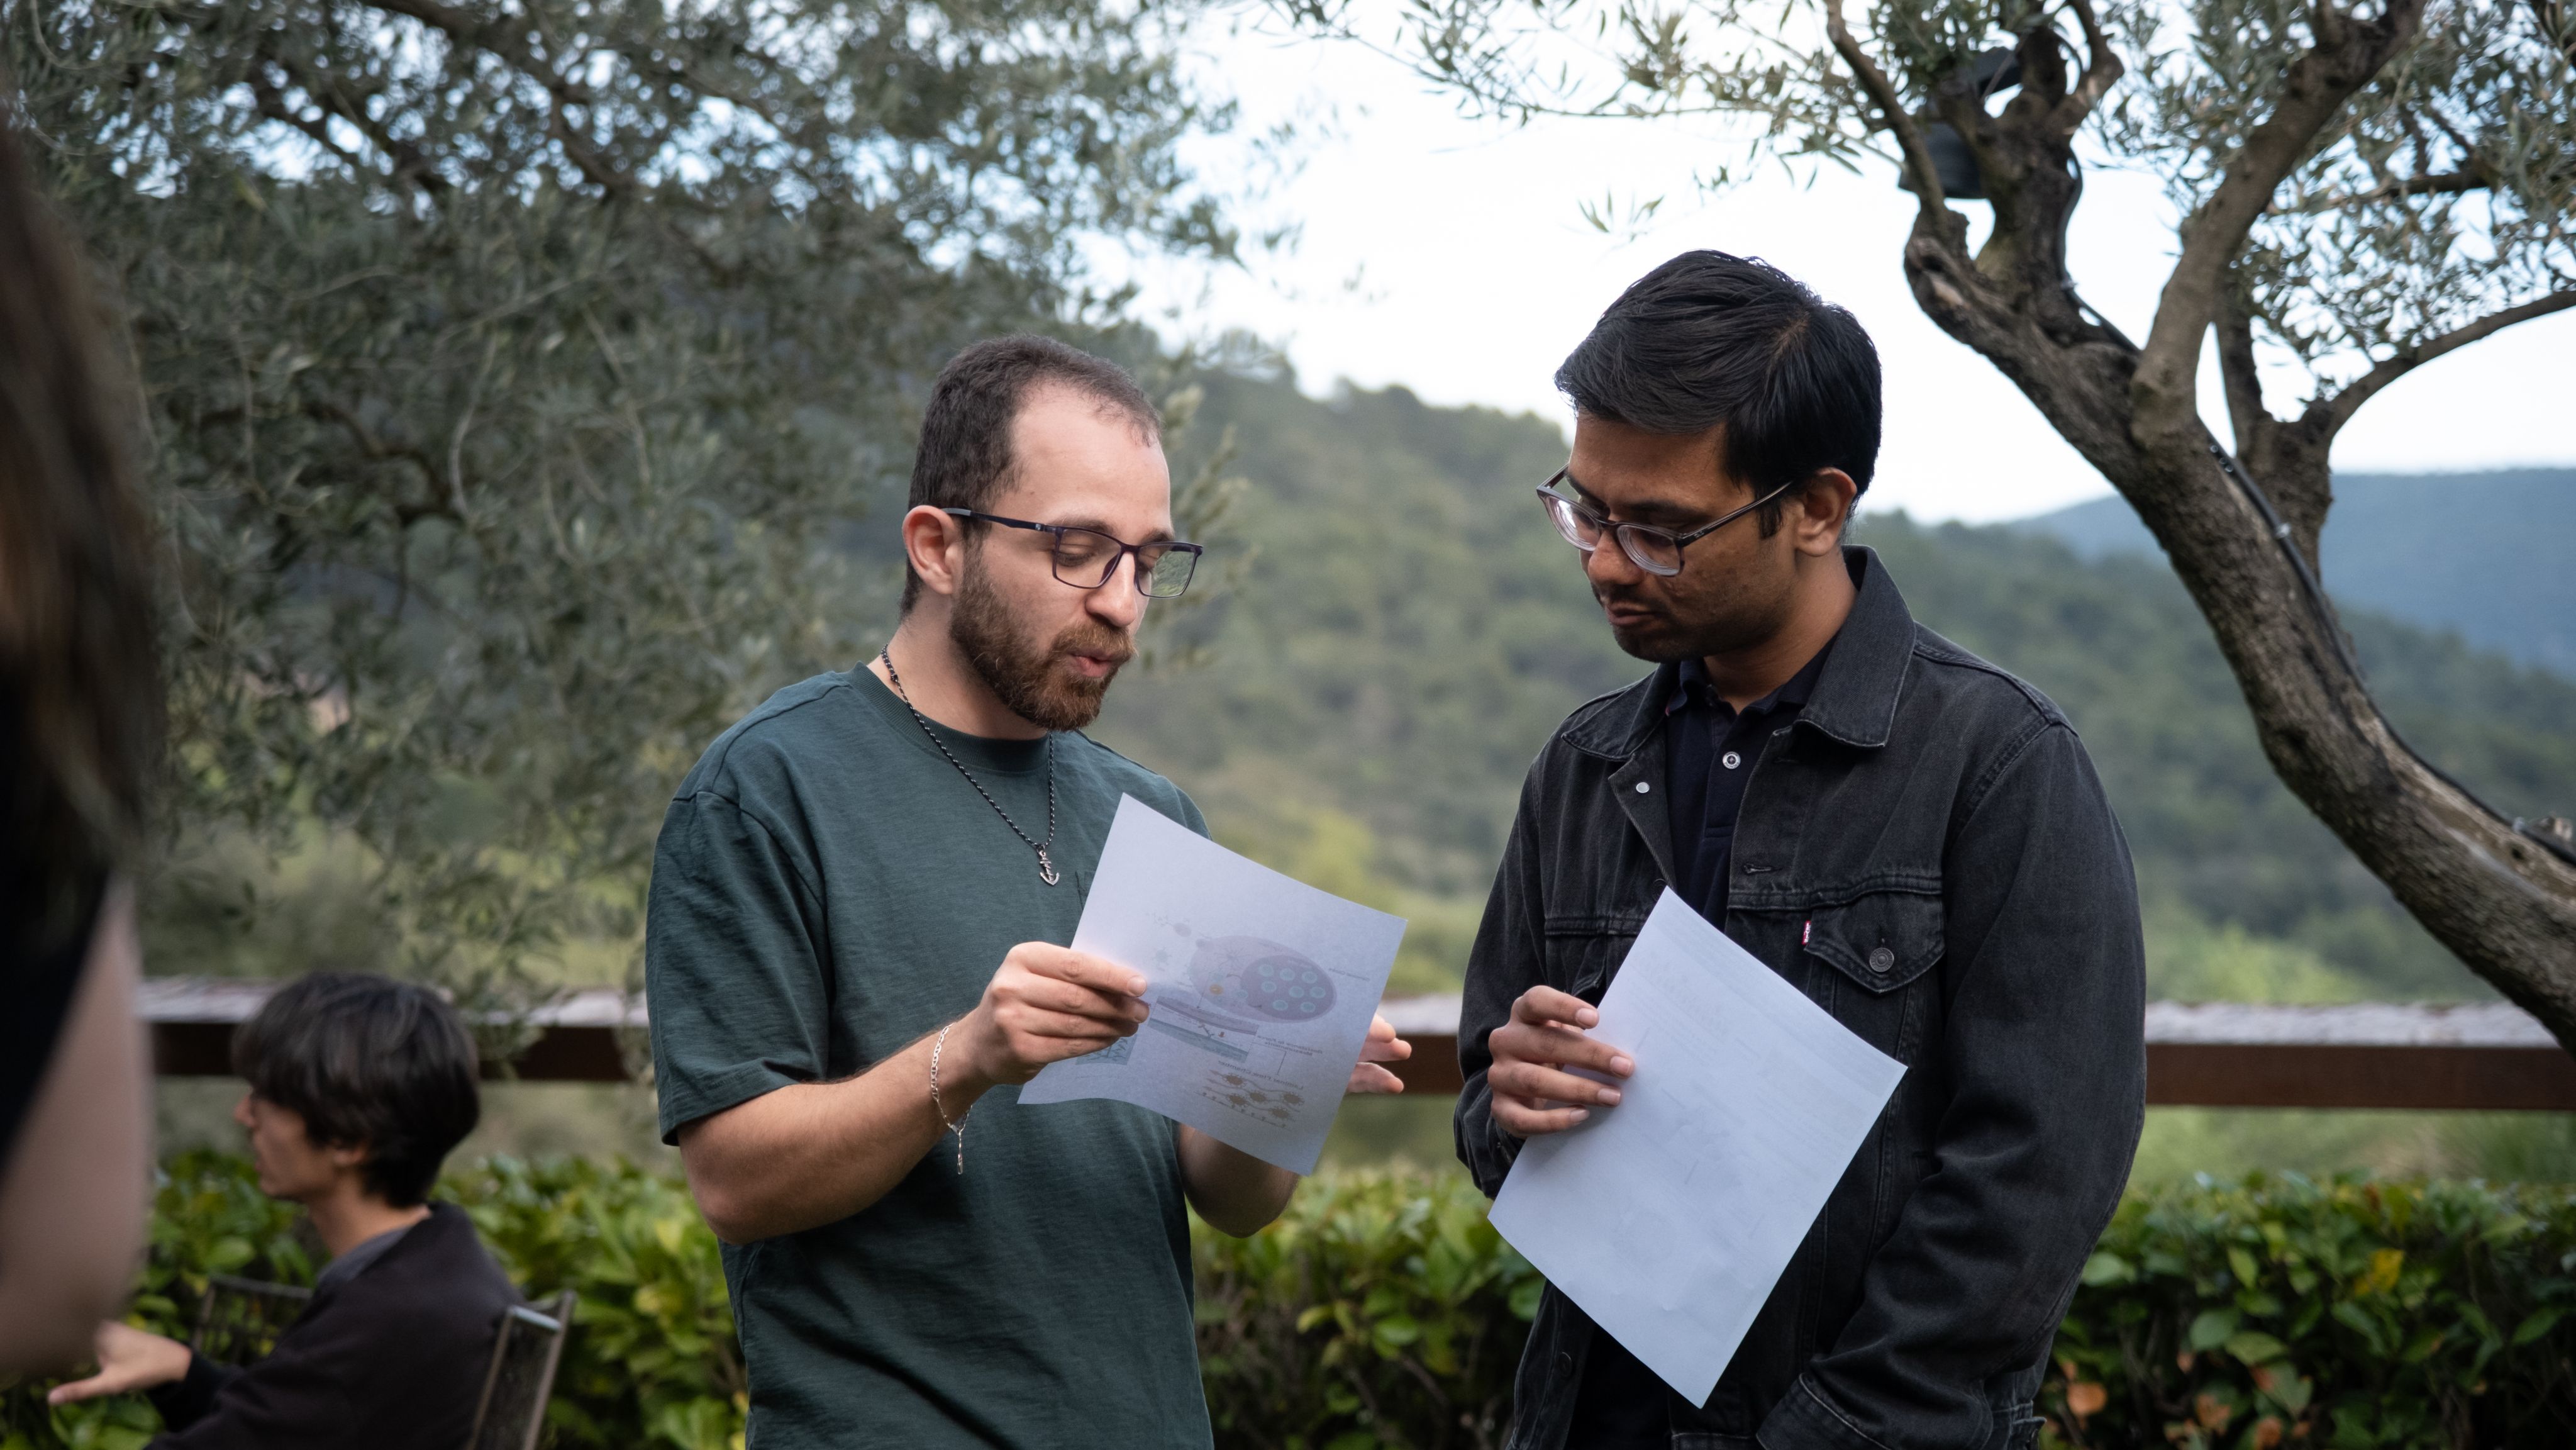
In our laboratory, Pierre-Henri Puech, one of the co-organizers, opened the conference with a foundational talk on immunobiophysics. Philippe Robert was among the invited speakers and delivered a presentation titled “CD16 Transmits Defined Piconewton Forces During Natural Killer Cell Activation.” Our Ph.D. student, Gaurav Verma, also contributed to the event by presenting a poster on his current research project titled “Edit-T-cell Spreading Dynamics Mediated by New Bispecific Agents“.
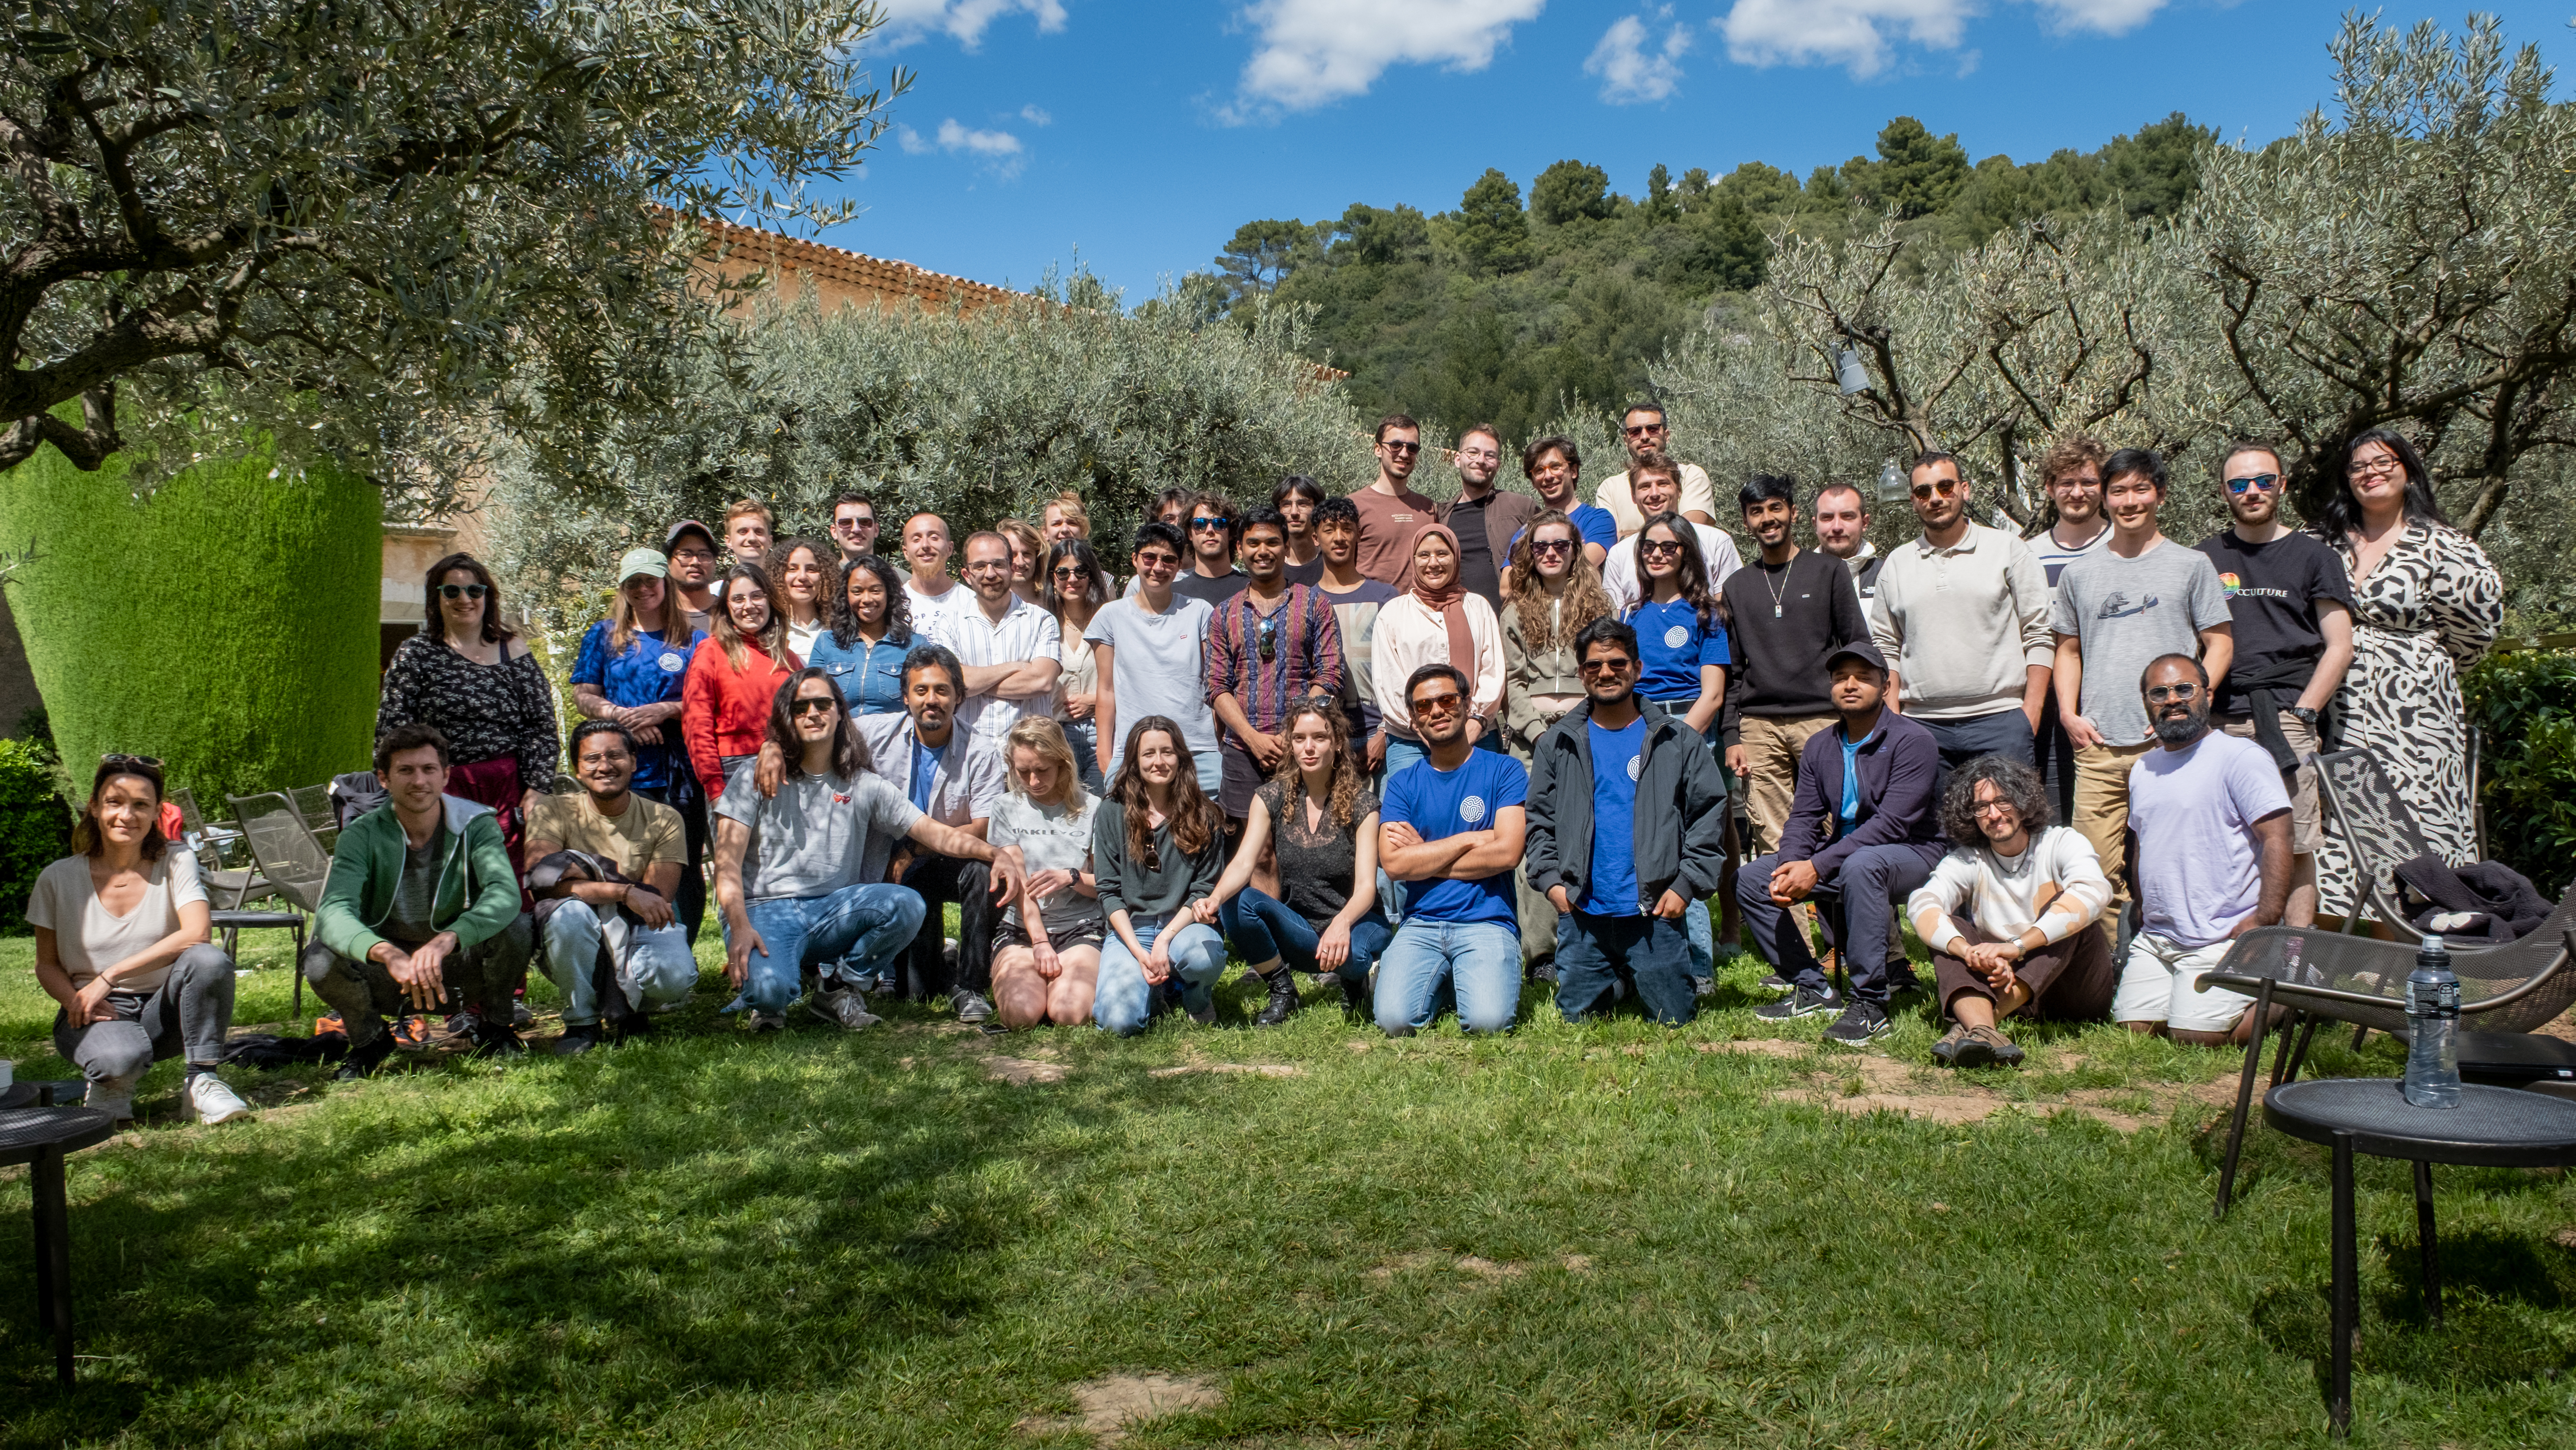
Five PhD students from our lab, Jad Sleiman, Gaurav Verma, Ahmad Awada, Marie Dessard and Jana El Husseiny participated in the recent CENTURI retreat, held in Gorges du Verdon from April 23 to 25, 2025. The event brought together PhD students and postdocs for a diverse program of scientific exchange, skill-building workshops, and outdoor activities. Attendees took part in sessions ranging from microscopy and debating to kayaking and astronomy, all designed to strengthen our academic community.
We extend our sincere thanks to the CENTURI organizing and administrative committees for making this event possible.
A current challenge in bioimaging for immunology and immunotherapy research lies in analyzing multimodal and multidimensional data that capture dynamic interactions between diverse cell populations. Here, we introduce Celldetective, an open-source Python-based software designed for high-performance, end-to-end analysis of image-based in vitro immune and immunotherapy assays. Purpose-built for multicondition, 2D multichannel time-lapse microscopy of mixed cell populations, Celldetective is optimized for the needs of immunology assays. The software seamlessly integrates AI-based segmentation, Bayesian tracking, and automated single-cell event detection, all within an intuitive graphical interface that supports interactive visualization, annotation, and training capabilities. We demonstrate its utility with original data on immune effector cell interactions with an activating surface, mediated by bispecific antibodies, and further showcase its potential for analyzing extensive sets of pairwise interactions in antibody-dependent cell cytotoxicity events..
A. An end-to-end GUI pipeline for studying interactions between target and effector cell pairs (from left to right). After loading an experiment project that mimics a multiwell plate structure, the user can apply preprocessing steps to the 2D time lapse microscopy images before segmentation. Target and effector cells are then segmented, tracked, and measured independently. Events are detected from the resulting time series, and the co-culture images are distilled into tables of single-cell measurements. The neighborhood module links cells in spatial proximity, and the cell-pair signal analysis framework facilitates the investigation of interactions between cell pairs. Eye and brush icons indicate steps where visual control and corrections are possible, with an appropriate viewer.B.Schematic (top) and snapshot (bottom) of a spreading assay imaged by time-lapse RICM. C Intensity time series for a cell performing a contact and spreading sequence. D Schematics side-view of target/NK cells co-culture assay for bispecific ADCC (top) and representative multimodal composite images, obtained at two different time points, with target nuclei labelled in blue, dying cells in red and NK cells in green (bottom). Corresponding colors are also used in the schematics. Decomposition of partly overlapping fluorescence channels and benchmark of segmentation DL models
Experiments with gradients of soluble bioactive species have significantly advanced with microfluidic developments that enable cell observation and stringent control of environmental conditions. While some methodologies rely on flow to establish gradients, other opt for flow-free conditions, which is particularly beneficial for studying non-adherent and/or shear-sensitive cells. In flow-free devices, bioactive species diffuse either through resistive microchannels in “microchannel-based” devices, a porous membrane in “membrane-based” devices, or a hydrogel in “gel-based” devices. However, despite significant advancements over traditional methods such as “Boyden chambers”, these technologies have not widely disseminated in biological laboratories, arguably due to entrenched practices and the intricate skills required for conducting microfluidic assays. Here, we integrated Quake-type pneumatic microvalves in place of microgrooves, membranes, or gels, and developed devices with precise control over residual flow, establishment initial gradient, and long-term stability of gradients. The “Microvalve-based” approach enables the generation of the automatization of delicate microfluidic manipulations, which paves the way for routine applications of controlled and tunable flow-free gradients in academic laboratories and biomedical units.
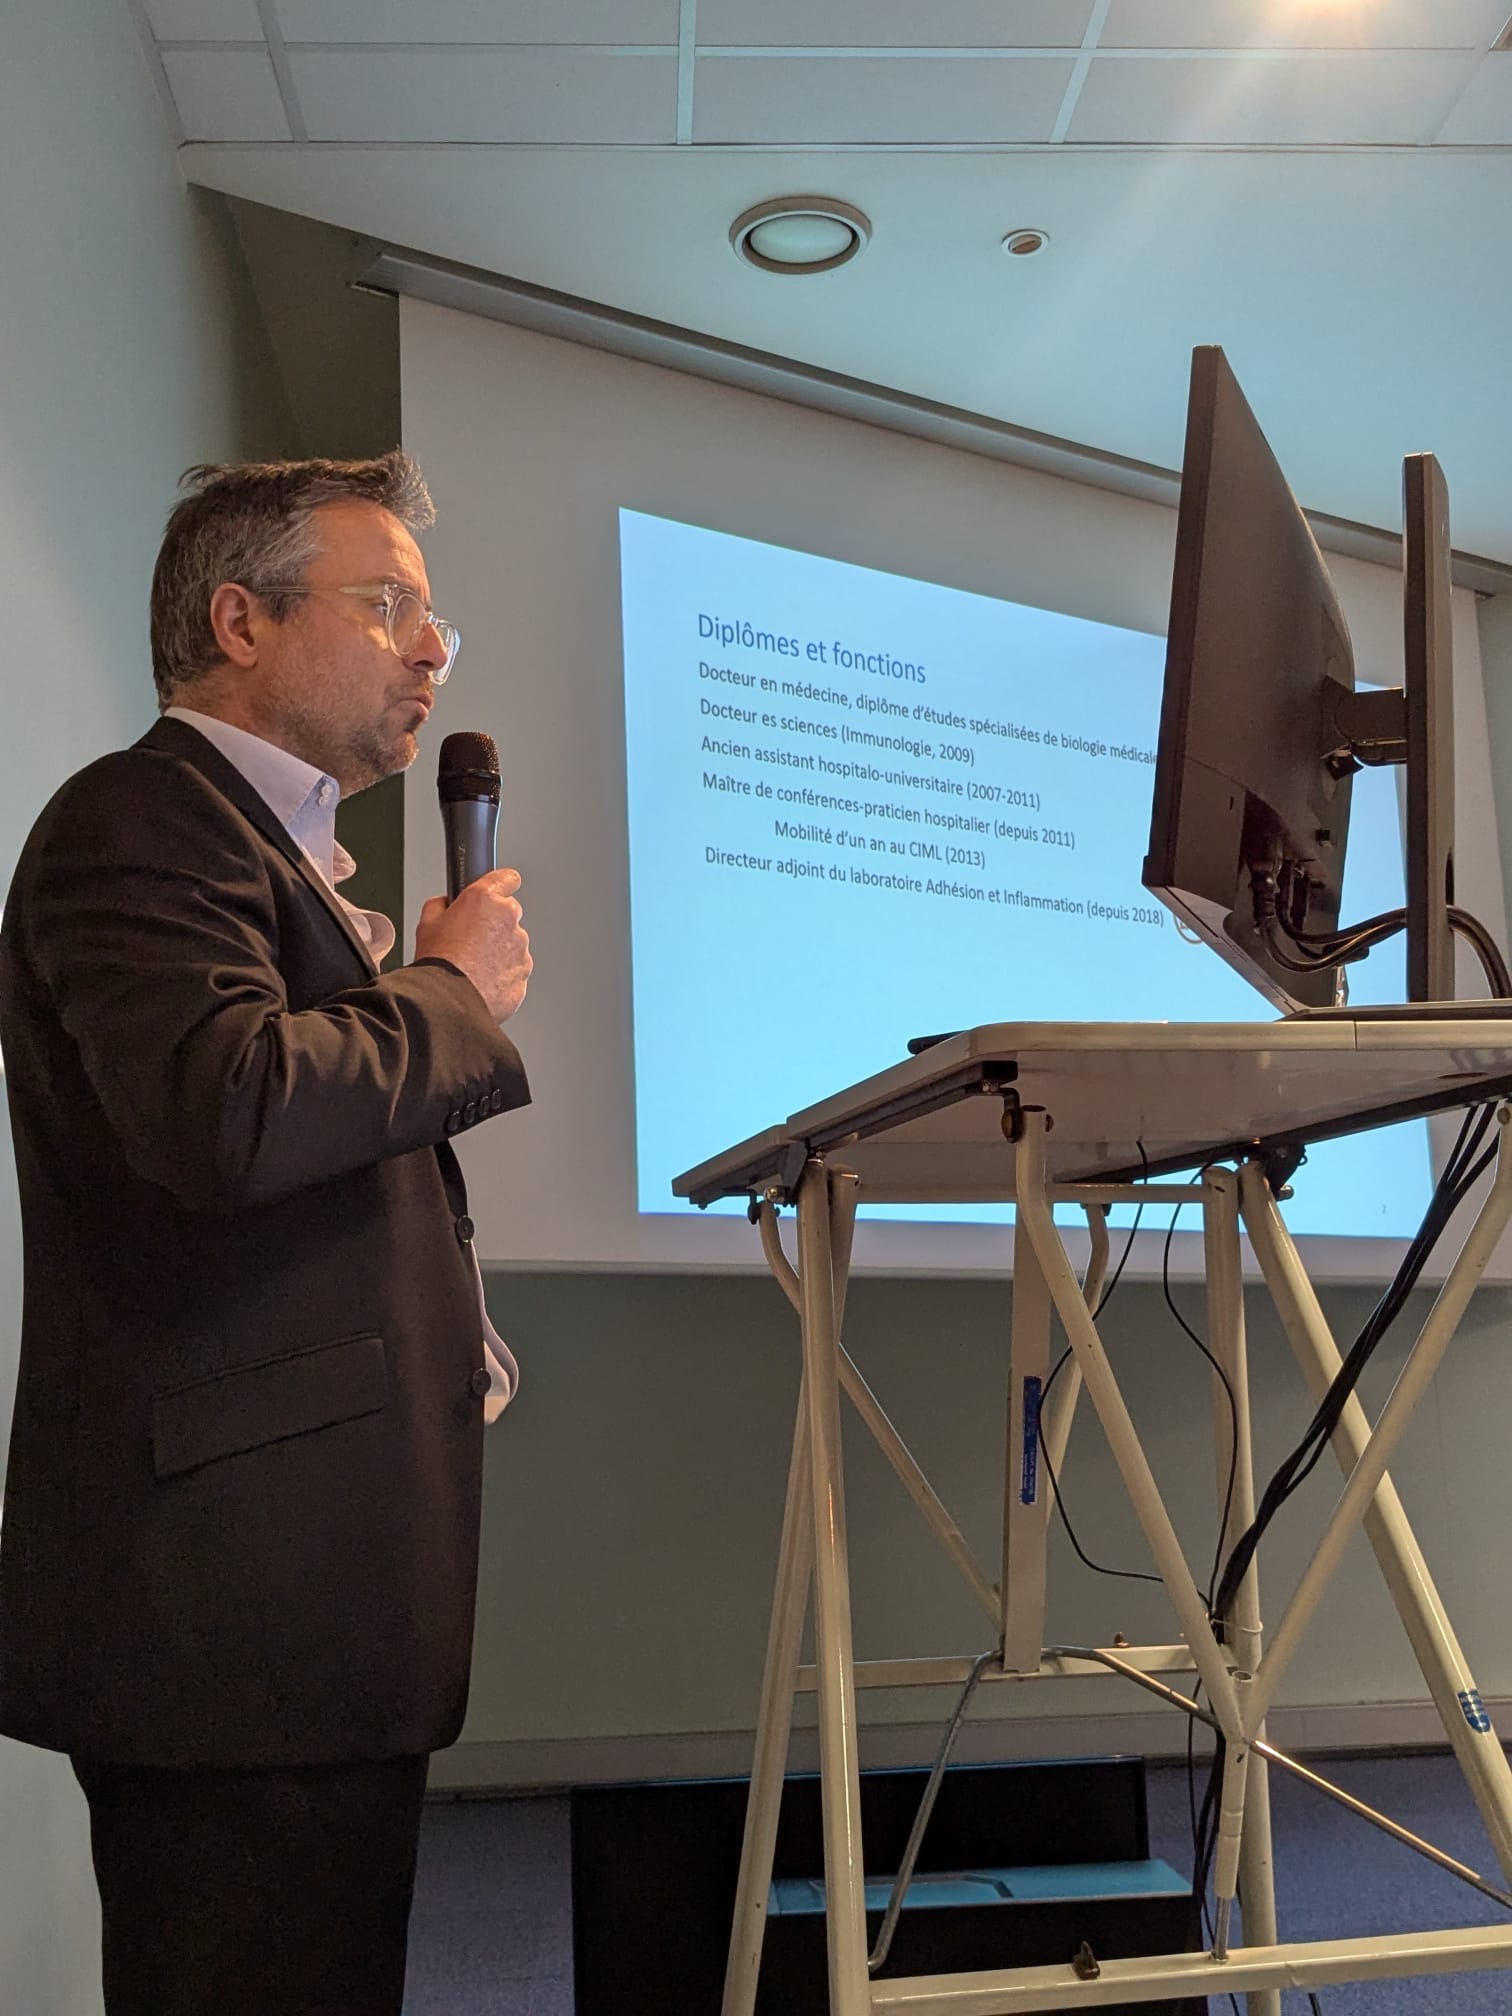
Philippe Robert defended his Habilitation à Diriger des Recherches on February the 14th, 2025. He presented his work on the measurement of kinetics of TCRs and antibody-antigen bonds at the single molecular level under physiological forces, with numerous methodological developments that accompanied it. He also described medical applications of the method, with results regarding the quantification of leukocyte-endothelium interactions during inflammation and thrombosis. Finally, he presented the current state of development of microprinted assays for quantification of leukocyte functions that he patented with Olivier Theodoly, that aim to bring to routine use for patients functionnal assays that are currently too slow and expensive to be used in the hospital.
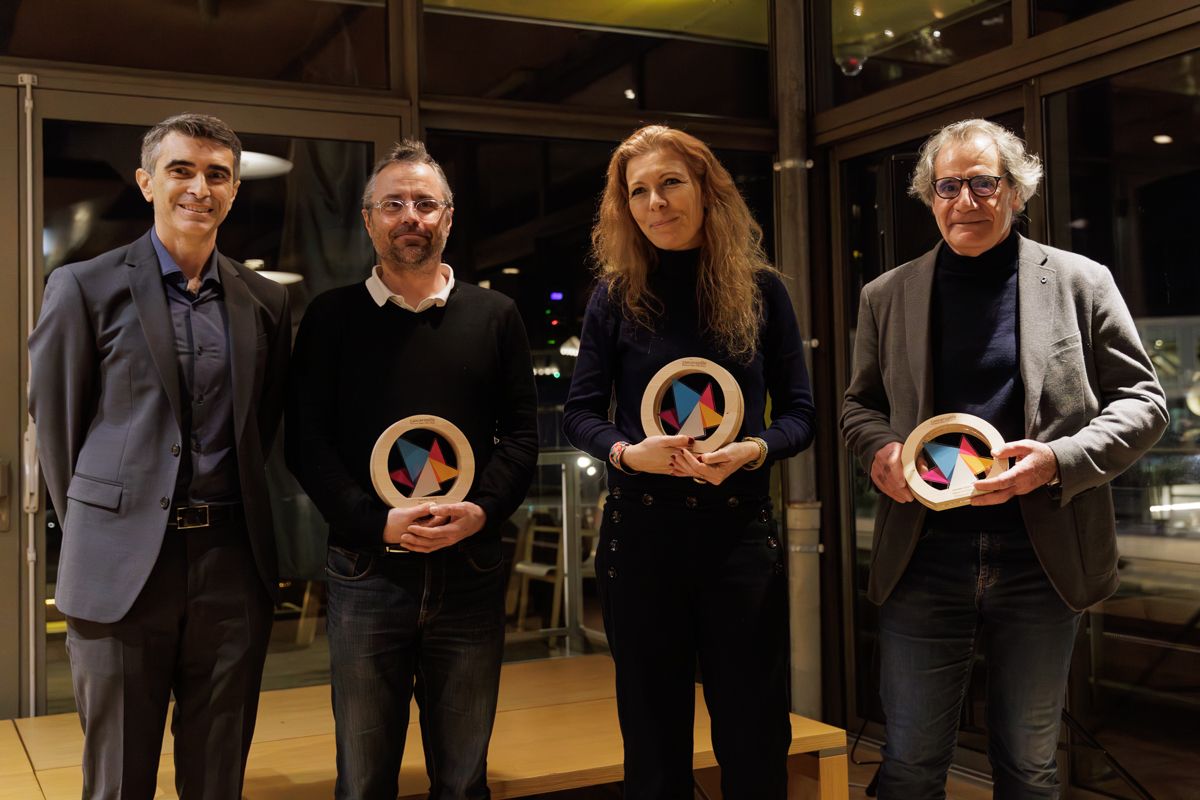
The project Microchip-based Functional Leukocyte Testing for Immunotherapy, led by Olivier Theodoly and Philippe Robert, has been selected as a 2025 Canceropôle Provence-Alpes-Côte d’Azur grant recipient.
The project is based on an innovative technology developed at the Laboratory of Adhesion & Inflammation (LAI) in Marseille and the Interdisciplinary Institute for Neurosciences (IINS) in Bordeaux, patented in collaboration with CNRS Innovation. Using molecular microprinting, this approach enables the fabrication of microchips with precisely controlled amounts and micrometer-scale patterns of multiple antibodies.
The goal is to make these microchips suitable for routine hospital use, providing a more accessible alternative to conventional techniques, which are often costly and time-consuming for hospital technicians. By developing these new tools, this project contributes to advancing rapid diagnostic solutions and personalized patient monitoring in immunotherapy.
The awardees were honored at a special event hosted by Canceropôle Provence-Alpes-Côte d’Azur on January 31, 2025, at the Musée Regards de Provence in Marseille.
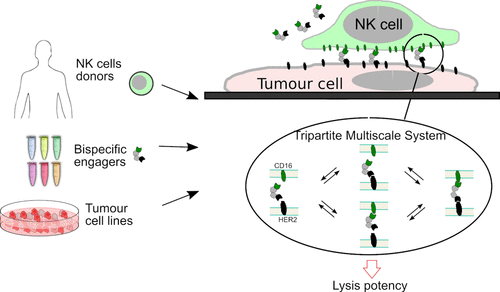
In recent years, immunotherapy has brought about a paradigm shift in the treatment of cancer, making it possible to stimulate and re-arm the immune system against the disease. One strategy already used against certain cancers involves injecting molecular engaging agents (e.g. bispecific monoclonal antibodies) capable of recruiting immune cells such as lymphocytes to directly attack the targeted tumour cells. These bispecific molecules act as a molecular bridge between activating receptors on immune cells and tumour antigens exposed by the target cells. Despite the potential of these new agents, the ability to predict their efficacy remains limited, as it depends on both the patient and the details of the agents molecular structure. Patrick Chames and his team (CRCM) have for several years been developing bispecific antibodies constructed from camelid monodomain antibodies, known as nanobodies.
the authors tested in-vitro a range of 6 original bispecific antibodies combining several nanobodies, and recruiting Natural Killer cells from 15 healthy donors to different target tumour cell lines. They systematically measured the quantity of target cells killed for varying concentrations of engaging molecules, taking into account biophysical parameters such as antibody affinity and receptor density. These data showed that it was possible to largely decouple the role of donor cells from the molecular details of the engager to predict the effective engager dose. They also proposed a simple formula for quantitatively predicting this effective dose in vitro.
Original bispecific engager molecules are being tested to recruit immune cells from healthy donors to kill tumour cells. Donor and molecule parameters are decoupled and the multi-scale model predicts the optimal dose required to kill in vitro (Credit: L. Limozin).
On January 10, 2025, a half-day “TPR2 Inserm Meeting” at Hexagone, was held to bring together the four single-teams and shared services housed in TPR2 building. This convivial event gave the building’s staff the opportunity to meet each other and consider new opportunities for collaborations. The event ended with a traditional “Galette des rois”.
In our lab, we celebrated Christmas with a festive lunch featuring a variety of delicious foods and sweets, along with a fun Secret Santa gift exchange. It was a wonderful way to wrap up the year, share memories, and enjoy good vibes with all the lab members. The event was filled with laughter and positivity. Here’s to another year of exciting projects and great moments together!
We are pleased to announce the publication of a review authored by Pierre Bongrand in the International Journal of Molecular Sciences. This review examines the growing integration of artificial intelligence into everyday biomedical research and practice, questioning whether this represents a true scientific revolution or a temporary hubris of its potential.
The paper explores:
Insights based on a review of past scientific progress, with an emphasis on immunology, it is concluded that current “omic” data contain useful information that is not adequately interpreted by currently available theoretical processing methods.
A brief description of currently available artificial intelligence tools is presented, with a discussion of expected potential and pitfalls.
Applications of AI in the biomedical field, are described with an emphasis on the biomedical domain.
It is concluded that it is already warranted to apply artificial intelligence to routine biomedical practice, but it is essential to develop validation procedures.


You must be logged in to post a comment.